The Toronto real estate market had a set of very mixed results for the month of April with the condo market experiencing a large slump in sales due to a substantial influx in inventory while semi & detached home sales/prices have surged.
With many buyers still being sidelined by higher interest rates, we are seeing this impact the condo sector the most as first-time purchasers & investors are most sensitive to these increased borrowing costs.
April 2024 | TREB Stats
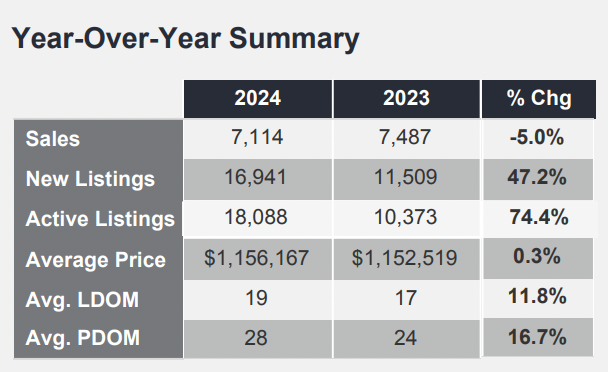
- Sales = 7114 (-5% vs. 2023)
- Average Price = $1,156,167 (+0.3% vs. 2023)
- New Listings = 16,941 (+47.2% vs. 2023)
- Active Listings = 18,088 (+74.4% vs. 2023)
- Average Listing Days on Market = 19 (+11.8% vs. 2023)
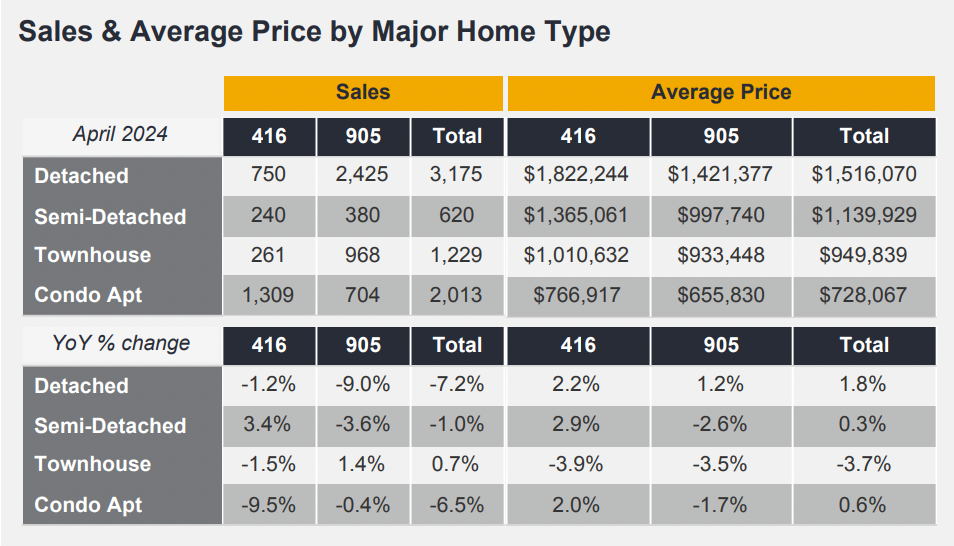
- Detached
- Sales = 750 (-1.2% vs. 2023)
- Average price = $1,822,244 (+2.2% vs. 2023)
- Semi-detached
- Sales = 240 (+3.4% vs. 2023)
- Average price = $1,365,061 (+2.9% vs. 2023)
- Townhouse
- Sales = 261 (-1.5% vs. 2023)
- Average price = $1,010,632 (-3.9% vs. 2023)
- Condo
- Sales = 1309 (-9.5% vs. 2023)
- Average price = $766,917 (+2% vs. 2023)
Breaking these stats down even further by neighbourhood provides a clearer picture as to what is happening around Toronto.
Toronto East - Detached homes was one of the best performing sectors in the city.
- Sales = 259
- Average price = $1,350,969
- New listings = 512
- Active listings = 389
- Average % of list price = 107%
- Indicates properties selling for over-asking
- Largely comes from the return of holding off/underpricing strategy
- Indicates properties selling for over-asking
- Average days on market = 12
- E03 had the most sales (48) with an average price of $1,508,472, typically getting 112% of list price & selling in an average of 11 days
Toronto East - Semi-Detached homes were the most active of their segment in the city.
- Sales = 92
- Average price = $1,262,652
- New listings = 132
- Active listings = 68
- Average. % of list price = 112%
- Again shows properties selling for drastically over-asking
- Average days on market = 10
E01 (Riverdale/Leslieville) & E02 (Beaches) were tied for the most amount of sales (22)
- E01 had an average price of $1,410,500 with the typical property selling for 110% of list price after 12 days on the market
- E02 had an average price of $1,392,803 with the typical property selling for 114% of list price after only 9 days on the market
Townhouse sales were pretty similar throughout the city with the most expensive being in Toronto - Central (average price of $1,480,793)
- All areas sold over asking (105-109% of list price) & sold relatively quickly at just under 2 weeks
- W02 (Junction/High Park/Runnymede) had the most sales (13) with an average price of $1,315,031 which was typically 114% of list price
Condo sales in Toronto - Central were significantly higher than anywhere in the city with 827 units sold (300 of these were in C01 (Downtown) ~ 156 in C08)
- Average price = $829,501
- New listings = 2688
- Active listings = 3479
- % of list price = 99%
- Selling for just under asking
- Average days on market = 26
This fractured landscape is likely to persist for much of 2024 as inventory in the housing sector stays relatively low compared to demand while condo inventory is expected to keep rising with the completion of numerous new buildings around the city.
Have any questions about the market?
Feel free to message me on Instagram @TorontoRealEstate.ca !
Rylie C.
Comments